This is an awesome representation of the intercellular space of a desmosome (that I am not giving a classification to…. either coming, stable, or going since apparently the intercellular area undergoes ultrastructurally visible changes, namely the loss of the central dense periodicity, as they change states). The paper by He, Cowin, Stokes appears in Science linked here. Two reasons that I love but dont like this diagram. 1) it depicts exactly what can be seen with traditional transmission electron microscopy of the intercellular area of desmosomes, but 2) it doesn’t seem to ring true that the organization since a “knot” is less orderly? in my mind, more “chaotic”, and I think the electron micrographs show the intercellular organization is way more orderly than the diagram suggests. 3) the number of molecules in the colored diagram (part A as they label it) is more than I seem to see in the sections with TEM. The banding (i am guessing most agree to be desmocollins and desmogleins) is so regular, and the space between so lucent, that all the knot like other molecules are likely overrepresented.
I agree that in this particular view here there is only a tiny hint of any symmetry. I do like that the dimers that they have highlighted (one actually as a lambda, my favorite representation, and the one that fits the intercellular space-repeating order of a desmosome in many of my own electron micrographs best — lambda shapes mirrored vertically and ofset by half). There is no way here to tell if something was influencing the desmosmal structure (e.g. the presence of a very close mitochondrion, maybe participating in the formation or destruction of the desmosome in their picture). Lots of opportunity for that variability to be a part of a process influencing what is viewed as a chaotic knot which in fact was a highly organized intercellular component of the desmosome. I am linking their image to their article.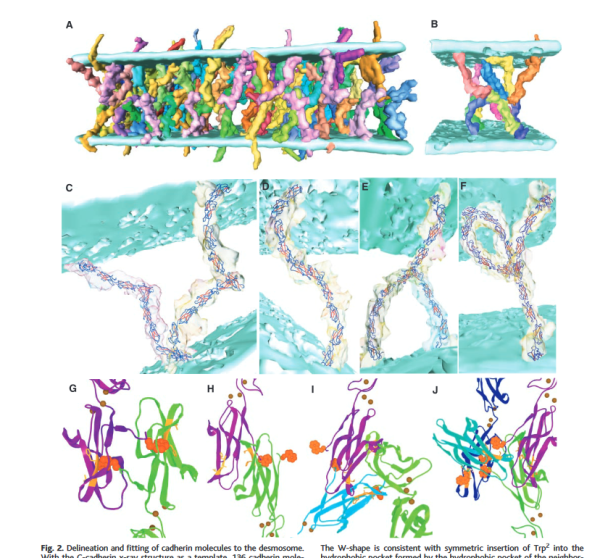
(it would indeed be fun to have access to that equipment, and knowledge of how to use it, and possess the specimens made to order, poof, all at once and with extreme precision).
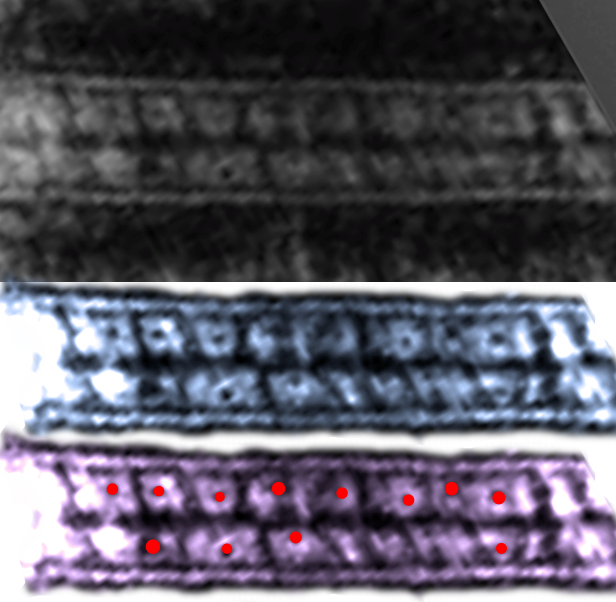
This publication also shows some TEM images of desmosomes which i did some measurements with: the distances between the densities at the outer plasmalemma of both cells, and the distance between the periodicities of the central dense line of the intercellular space. All distances were similar… mean of all was about 4nm center of density to center of density. The intercellular width (from the outer plasmalemma to the adjacent cell was about 9nm. See lines from that TEM below (link to the manuscript is above).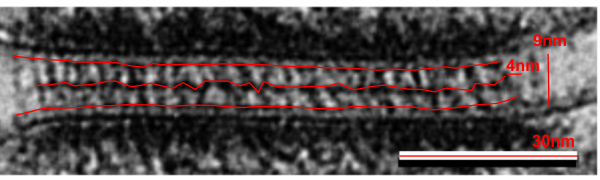
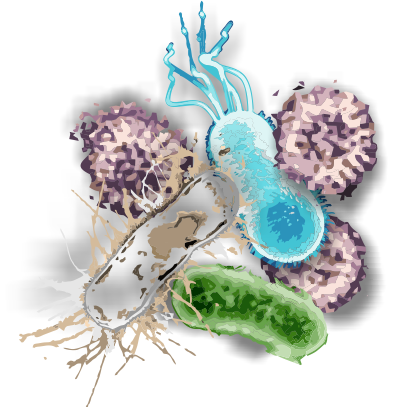 i just really enjoy thinking that i am so much the greater part “not me”…. mostly “other” which means my consciousness is probably the most dominant “me” occupying more a spiritual and extracorporeal space than a physical space – how fun is it to be “thought” occupying a mostly “microbiotic” house