Daily Archives: June 21, 2017

Nuclear pore gallery-2

Adding more profiles of nuclear pores, from several different knock-out mice, basically to see whether the parameters I have set (chromatin exclusion zone, nuclear pore to nuclear pore distance, and distance between 20 nm DNA particles) changes with metabolic, or oxidative, or cell cycle (including apoptosis) stressors, and to see whether densities (probably pre-mRNA and other larger proteins that show up as occupants of the center of the nuclear pore) can be found to vary with similar cell states.  I subjectively choose the nicer looking pores, tending to bet mid-cuts, and some subconscious bias likely causes me to choose those pores with transport molecules, as here about 87% of pores have center densities, while when counted in a single micrograph (not my selection) the ratio of pores with and without central densities is closer to 50%.  we will see. The octagonal symmetry is very clear.
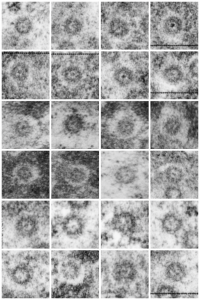
nuclear pores top down transmission electron micrographs


Measurements of areas surrounding the nuclear pore: hepatocyte


Some measurements (see previous post for comparison data), might be useful in a relative sense to others looking at nucleus, nuclear architecture, and nucleolar architecture.

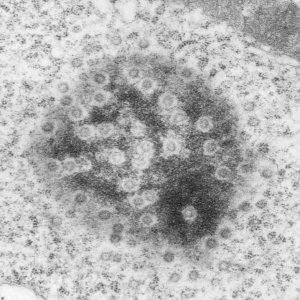
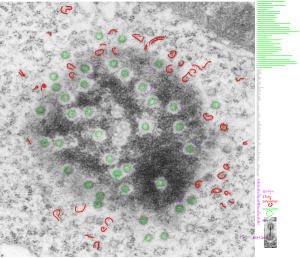
This particular image is unretouched tangential section of an hepatocyte nucleus (17529neg73229block, anm203,wcii -Gclc 28d).  There are numerous nuclear pores sectioned tangentially in this image, about 35 of which are there 15 or so in sufficient detail to demonstrate a density within the center of the nuclear pore demarcating the site that pre-mRNA and larger particles are ushered through (both ways) (about 44%). Compare this micrograph with a previous post of a similar tangential section for parallel measurement.  They are not identical, but close. Curley red lines demarcate polysomes.

In this micrograph the pore to pore distance is n=34 x=482+177nm, the distance from the outer part of the nuclear pore to adjacent chromatin is n=97, 62.7nm +/-32nm, and the distance between the 19-20 nm beads on a string in the chromatin next to the chromatin exclusion area is n=39, 46nm +/- 13nm. The actual measurements are shown at right (green=pore center to pore center), grey=chromatin exclusion areas, that is the distance between the edge of the nuclear pore and the adjacent chromatin, grey, and purple, the distance between the 20nm beaded-periodicity found in the pore-adjacent chromatin.

electron micrograph hepatocyte measurements of nuclear pore and exclusion area and chromatinelectron micrograph hepatocyte measurements of nuclear pore and exclusion area and chromatin