Monthly Archives: July 2019

Astounding inaccuracy in a scientific diagram of surfactant protein A

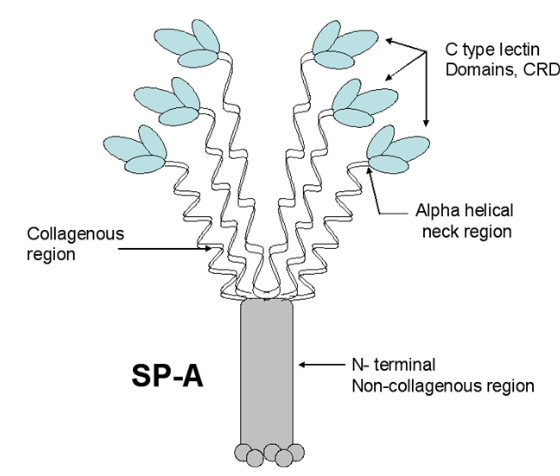
Remember playing “telephone” as a kid (also called “chinese whispers” — the title of which in and of itself denotes confusion)? Here is a link to wikihow if you never played it. The purpose is to show “in real life” what happens when information is casually passed from one to another (as in gossip… and i am calling the remake of scientific illustrations from previous publications as a similar phenomenon).  The important truth is that information is easily corrupted. No more description is needed for the image below which is supposed to portray surfactant protein A.  Clearly this artist/scientist team knew very little about SP-A or they were playing “telephone” with the specifics of how to draw the diagram.

What is sad to me is that this really bad diagram shows up in a place where many individuals might actually expect accuracy (a site called Global Science Books ) ? A link to the pdf that I found is HERE.

I will list what I think they missed, data from SFTPA1 online and the literature.

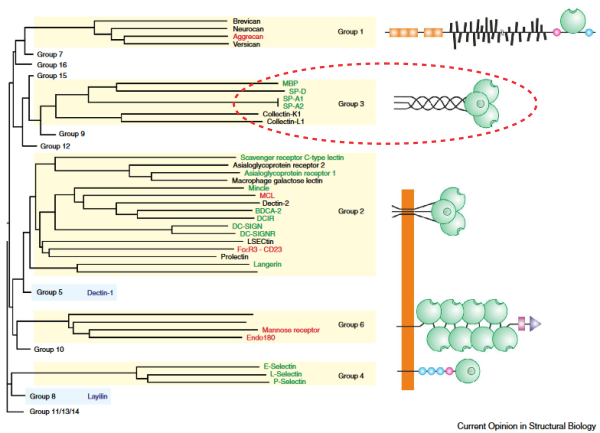
  1.  The ratio of AA for each of the 4 domains seems to be wrong, as the N terminus is very short, the collagen like portion is pretty long (blue), coiled coil neck domain (black) is not too long, the CRD (red) is quite long.  The relative distances of these four domains in this diagram are quite far off, in spite of the fact that many much better diagrams are available for free. Signal peptide is 1-20.
  2. Where did the third strand of the collagen-like domain go? It looks to me like the two twined black lines in their diagram are just that “2” not “3” as repeatedly mentioned in texts (every text i have read in fact) and why would it be called a trimer if not three, and how in the world does the third CRD domain hook up when there is no line in the collagen like domain to which to attach it?
  3. There is virtually no distinction between the winding of the collagen-like domain and the coiled coil neck… an arrow points to the transition, but there is not definition, and as well, there are only 2 of the 3 strands in the neck domains present.
  4. It is difficult to interpret the trunk like portion of this diagram, and how it might relate to the interactions between the collagen like domains, of the 6 trimers. It might be noted that in their diagram (not shown here) lying right next to this SP-A diagram shows the dimer of SP-B in the same two lines as the trimer of SP-A? Why?
  5. What in the world are the “balls” circles at the N terminus? Is this a depiction of N termini binding sites?
  6. Why are the three supposedly nearly (if not absolutely) identical CRD pictured in different sizes?. If it is an attempt at forshortening in graphic design if fails miserably.

OK, this is enough, you get the point.


Apollo anniversary launch: Guinnes book of records

Here is my 10 minute rocket to launch tomorrow to be part of the Apollo Moon Landing Mission.
I remember watching that event unfold on a very small black and white TV set, in an efficiency apartment at Matson Place in Cincinnati Ohio. It was an exciting view.

With 10 minutes required to create the rocket and 5 minutes to sign up as a participant on the website  I am ready to use a straw to puff-power my rocket into space  (July 16 2019) and be part of the guiness book of records for the #GlobalRocketlaunch

Test launches have been awesome….  5 feet.  ha ha.

Lift off 7 16 2019 9:30 am EST, video here    — ha ha… too fun. #GlobalRocketlaunch
https://youtu.be/oYwH5XsYjsc


Two possible configurations for SP-D multimers

There are micrographs to support both arrangements of SP-D fuzzyballs.

There is side to side N termini attachments for SP-A multimers, why not SP-D, since clearly there are images which support this arrangement.  The publication by Arroyo et al from which this fuzzyball is taken has a different LUT plot than the one i see.  I see a definite dip in the lightness (brightness, luminance whatever you want to call the grayscale) in the path of the two arms they created. (Their diagram is below – with my comments below my crop of their table of LUT plots).

My red arrow  (left, second image from left) lies right over an area of low greyscale values (you can also see this on my rendition of their AFM above) but their plot to the right of that image (shows the peak grayscale (that is the higher height value on their Y axis) on the wrong side of the image.  Two bright bumps in the plot, on the left, but in the image they are on the right.  Second problem with this portion of their diagram is that the fuzzy – ball they draw has NO central denser area. That makes it more equivalent to the fuzzyball in my group of images (labeled 1) and the diagram to the left of it.  Whether the solid center height (lightest of the grayscale (highest number and greatest height) could be the glycosylation site and N terminal or might just be the N terminal in a V shape with side to side attachments.


My personal view is that the three collagen-like domain peaks (which could include some of the coiled coil neck domain) remain as clearly visible peaks along the arms of the fuzzyball, though they are a little difficult to plot.

The next step is to measure from the very same micrograph the LUT plots and arm lengths of trimers, hexamers, dodecamers and fuzzyballs to see whether there is a significant difference in the diameter/length that might account for the dark center of some SP-D multimers. And I am not saying anything bad about the measurements of Arroyo et al, just want to see whether there are other things to be gleaned from their very nice AFM images.

Pity the Nation – Lawrence Ferlinghetti

pity the nation

I pity the nation of sheep with shepherds that mislead
I pity the nation where leaders deceive and sages are silenced
I pity the nation with voices of bigots praising bullies as heroes
I pity the nation with one language that scorns diversity
I pity the nation where wealth is monetary and brotherhood is scarce
I pity the nation where bellies are full and hearts are empty

(modified one more time from Khalil Gibran and Lawrence Ferlinghetti

Mini SP-D Ntermin and arm length and angle

Mini SP-D Ntermin and arm length and angle are quite close to measurements shown for images of SP-D by numerous authors. This little SP-D dodecamer image is from a publication by White et al, J Immunol 2008 and is described as having C3 and C4 of the collagen-like domain removed (these would be equivalent to the two lateral inbetween peaks that show up on LUT tables of AFM images of h and rSP-D and graphed a zillion times on this blog site.

In this case It is just noted that the central portion of the miniSP-D dodecamer is not that different from that of the full SP-D shown in other publications (rat mouse human). By the bar marker in this publication the rSP-D dodecamer is about 130nm from CRD to CRD on the opposite side. The miniSP-D is about 62nm from CRD to CRD on the opposite side, the center portion (the two N termini) of the mini-SP-D is about 22nm measured proportionally in reference to the estimated total width of the mini-dodecamer. This particular image is really interesting as well because if one looks closely at the “shadowing” and as i did, take the original 72ppi image and increase it to 600ppi then use a gaussian blur then the shading (shown below) is really beautiful and even demarks how the 2 N termini might come together side by side, rather than what I sort of guessed would be end to end.  Side to side N termini would explain a couple of things: 1) the width and height of N terminus peak in AFM images, and the presence of central “holes” in fuzzyballs (seeing as the side to side N termini binding would allow for V shaped association and then alignment in a circle or sphere with a cantral cavity.

In addition the arm angle of rSP-D (unmodified) is about 48o and is really close to the angle measured in the 10 shadowed images for miniSP-D shown in White, et al’s publication (see image just below).

.

Add to that a cutout of an image with greater pixel density and a line drawing of two potentially Nterminus to Nterminus in side attachement, and the shading (not mine or photoshopped shading but actual shading from the original micrograph) in clarity the 3 CRD at the ends of the mini SP-D trimers (all four arms and their 12 heads), the thin adjacent peak (as lightness close to 100% or lumance close to 250) which is probably C1 portion of the collagen like domain, and perhaps C2, and the absence of the stretch of C3 and C4 as predicted in the publication by White et al listed above. It would be great to have some AFM images, though this shadowed image is really nice. it might just be chance (maybe it is likely just chance) that the shadowing looks 3D and this is based upon the fact thta the shadoe cast images for SP-D (full size) in the same paper just does not show the detail that is  seen with AFM…. it does show other detail better however (like arm width).

What do those bends do?

SP-A exists (according to some published papers) in open and closed configuration…bending i guess only at the N termini juncture, and then again perhaps bending at the CRD and the neck. SP-D in fuzzyball multimers seems to be flexible at the N termini junctures as well, but I have no seen much text about the side to side N terminus connections in SP-D, which in my opinion likely exist similar to SP-A and some other “tulip type configuration” c-type lectin multimers.

Looking only at the “arms” where the collagen-like domains are doesn’t offer much suggestion that there are kinks in SP-D, but does suggest kinks in SP-A (also published data by others).

Here is a nice image (i added the circle over systems aligned with SP-D structure are) which is from a phylo tree from an article by Drickamer and Taylor which shows the collagen-like domain as a more or less straight portion of the 4 part trimer as an example, but without any reference to bumps or bends or lumps and also without any diagramatic representation of the coiled coil neck. Nonetheless it gives a view of the repeated elements in those 6 c-type lectins – which they assign to Group 9 – and i dont know what that signifies yet).

Individual LUT plots on 12 of the arms of an 18-mer (i think) SP-D multimer

I have shown two LUT plots of straight lines in the arms of 12 of the “likely” 18 arms of this SP-D multimer (would that I had access to better images… but I am having a difficult time finding original images or receiving donations for me to analyze.  However, these plots (original in terms of length for the top graph and rendered to 50 nm for the bottom graph then divided according to nm does show pretty much the same distribution for the LUT peaks as the dodecamers (i chose the blue plot (arm 9 of this dodecamer (you can see which one is arm 9 in the black and white AFM at the top) as it showed the small peaks in the collagen-like region and what is typical of multimers, a totally blended very white (grayscale at 100% or 255 which ever way you plot the grays — left most peak (that ends in the center (per the lines drawn on the fuzzyball)).  The width of the CRD stays pretty close to the dodecamer values (right-most peak on two bottom graphs).  Considering how fuzzy the original AFM image was/is, these plots remain consistent with the 5 peak per arm motif for SP-D arms.

AFM and LUT plots of SP-D dodecamer