Category Archives: Environment and contaminants

These blogs are about our interface with our environment, mostly the food and drink that is our greatest environmental interface, in my educated, anatomist’s opinion.

Quick comparison: vinyl chloride exposure vs toluene diisocyanate in lung

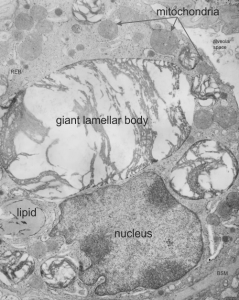
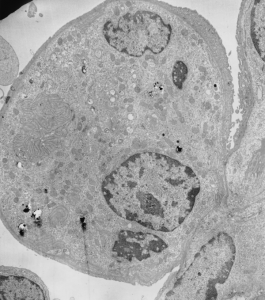
Quick comparison: vinyl chloride exposure vs toluene diisocyanate in lung — alveolar type II cells in guinea pig. Not going into much detail, but just an observation after comparing two strains of guinea pig (Hartley and English short hair (males)) from two different experimental protocols, each having their own age matched controls (from experiments performed way back in the 1980s by Dr. Martha Radike and Dr. Stuart Brooks (respectively) and looking just quickly at hundreds of images of type II cells (looking in fact for surfactant protein granules – an entirely different study) I would say that vinyl chloride exposure did two things quite differently than toluene diisocyanate. I am not going to dig up the exposure protocols, days exposure and stuff because it is published somewhere, but vinyl chloride definitely caused an increase in the lamellar body size, and a concommitant decrease in the amount of RER and other organelles in the cytoplasm. Lamellar bodies got very large, caused indentations to nuclei and sometimes fused into these really large lumpy lamellar bodies. In addition mitochondria got large, had cristae deformed by some kind of matrix issue, the electron density was not decreased in the matrix, but cristae looked pushed and squeezed, in addition to an occasional fluting of the outer mitochondria membrane. (BTW, liver mitochondria from vinyl chloride exposed animals did show differences from unexposed as well). Figure from neg 6476, block M8005, anm# 51, vinyl chloride, low vitamin C. See below, two great nucleoli, several mitochondria with diminished cristae to mitochondrial ratio, enlarged matrix, and odd shapes within mitochondria.  The RER in the cytoplasm doesnt fig the granular layered profiles that have been seen in guinea pig that I am trying to establish as surfactant protein A, but are dilated and atypical for an alveolar type II cell from an untreated, and well, guinea pig.

6476_M8005_guinea_pig_typeII_VC_lowVitC

Toluene diisocyanate on the other hand (and some of the control animals along with… so you can judge whether this is an animal room sickness affecting all guinea pigs or something unknown) did NOT show mitochondrial or lamellar body size increase.

Intra-cristae – membrane protein organized in mitochondria

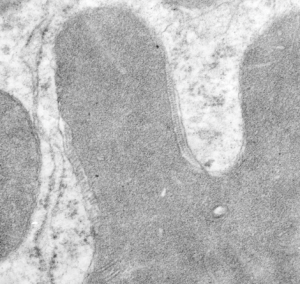
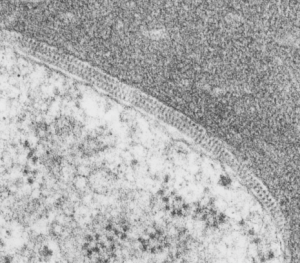
Intracristae – membrane protein organized in mitochondria — found in guinea pig liver electron micrographs in a retrospective study on vinyl chloride (and air) and vitamin C exposure from the 1980s. These cristae with apparent organizations of ATP synthase in a long row, parallel and sometimes looking staggered, sometimes aligned, have appeared in exposed as well as control (both groups receiving vitamin C). This is an awesome image with a 3-layered row of highly organized molecules looking a little like they are strung together somehow, yet each distinct. Just marvel at the order in the completely UNRETOUCHED electron micrograph  of a mitochondrion in guinea pig liver here.

4158_M8011_guinea_pig_liver_VC_vitC_HRMitochondria in both control and experimental data sets have mitochondria with wild shapes, very atypical for mitochondria in general, in some cases on section looking like asterisks (yep, same type outer membrane configuration seen in apoptotic cells). This is the case of the mitochondrion shown enlarged (the scalloped edges are just cropped so the ATP synthase is more visible. Image below 5924_17010_guinea_pig_air_vitC_liver.

As with the intracisternal body in the alveolar type II cell of the lung of many guinea pigs, when the protein within the cisternae of the RER begins to assume a substructure (in that case, a layered granule), then the resulting RER becomes very rigid looking.  Similarly here, when the cristae have the ATP synthase all aligned in alternating double rows, the intramitochondrial membrane and other elements in the mitochondria also take on a rigid appearance.

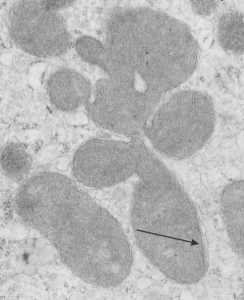
5924_17010_guinea_pig_air_vitC_liverMicrograph below shows a section of an example of odd shaped mitochondrion with an area of extended ATP synthase molecules head to head, and on the inner mitochondrial membrane a little bit of rigidity and a thickening of the membrane is seen (arrow).

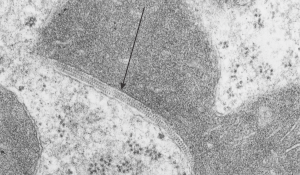
3548_M7991_guinea_pig_air_vitC_liverHere is a mitochondrion with an extended section of rigidity in the mitochondria membrane adjacent to a TRIPLE row of ATP synthase molecules, lucky cut (I hope that is what this is), and again rigidity in the mitochondrial membranes in this zone, and inner mitochondrial membrane has a slightly increased electron density about it (which of course means something, but I don’t know what).

4158_M8011_guinea_pig_liver_VC_vitC
HERE is a nice article…. it says the protein is in the matrix, which is not what is seen in the micrographs above, it is in cristae…. so there is some explaining to do on this topic.

Vinyl chloride and low Vit C exposure: guinea pig, liver, mitochondrion, intramembrane proteins

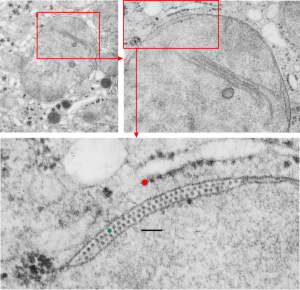
Vinyl chloride and low Vit C exposure: guinea pig, liver, mitochondrion, intramembrane, inclusions — a long title. This is an electron micrograph from the liver of guinea pig # 7 in a study about inhalation of vinyl chloride in conjunction with / without vitamin C. Dr. Martha Radike (who was a wonderful friend and colleague) did this study back in the early 1980s, but I don’t believe she ever published the results.  This particular animal (M8029) inhaled 600 ppm vinyl chloride 5 days a week for a year. The specifics of this which I cant remember (30 years ago) are 600 mmp VC, 4 hours a day, 5 days a week for a year, and this particular animal received 2-10 mg of vitamin C per day.  The mitochondria in lung, btw, were also very enlarged, though at this point I did not see any of these little inclusions within the mitochondrial membrane.

guinea_pig_liver_mitochondrion_vinyl_chloride_low_vit_CPublished reports have described changes from vinyl chloride exposure in liver: hypertrophy and hyperplasia of hepatocytes, activation and hyperplasia of sinusoidal lining cells, fibrosis of the portal tracts and the septa and intralobular perisinusoidal regions, sinusoidal dilation, and focal areas of hepatocellular degeneration. While the latter came out of a document that said DO NOT REFERENCE DO NOT QUOTE (oh well, excuse me), these are separate observations, but supportive of the unusual changes that Martha Radike (and I) found as mitochondrial changes seen in liver her year-long vinyl chloride exposure experiments in guinea pigs. There is a single mitochondrion pictured here, and two enlargements of areas (red boxes designate insets) which show the most wonderful inclusions I’ve seen twixt the outer mitochondrial membrane and inner mitochondrial membrane (I guess I could look for it in the intra-cristal membrane too but I haven’t yet). There are some misshapen mitochondria with cristae showing such in the air-breathing controls, which I will post, that received higher doses of vitamin C.  One wonders if the health of the entire colony played more into the results of all these changes (lung and liver both).

These little lollypops stuck on either side of the membrane are neatly alternating in a wonderful order and speak to something that I have not investigated but which was immediately apparent when I did googled “lollipops and inner mitochondria membrane” this may be ATP synthase. The dimensions are close to a reference I found: Structure of the mitochondrial ATP synthase by electron cryomicroscopy  by John L. Rubinstein, John E. Walker, and Richard Henderson.  There are some great videos on this molecular machine: HERE and HERE and HEREATP_synthaseIn the bottom section of the top micrographs the RED dot is @27 nm (ribosome), green dot @ 18 nm, bar marker, 100 nm. In the small bottom image i just cut and pasted two visuals of ATP synthase onto an enlarged portion of the above micrograph.  I added two charts to the pdf uploaded previously describing the materials and methods for vinyl chloride exposure. Find that document –> vinyl_chloride_vit_C_guinea_pig_lung1.

Next post is going to be a few pix of the ribosome bundle which is adjacent to some of these portions of intramitochondrial membrane with ATP synthase strings.

Mouse lung: liquid breathing E2

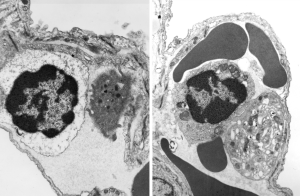
lymphocyte_plateletTwo archived electron micrographs from experiments in the 1970s which were part of liquid ventilation studies by Leland Clark, Jr.  These images are from a mouse that liquid breathed E2 (this is the hooker, I cannot find in my records what the chemical name for E2 is/was, but it is not what is currently searchable in google — what comes to mind is di fluoro methyl ether?).  This a mouse (typically swiss albino) was submerged in perfluorocarbon  for 15 min and tissues were taken at 0 min recovery.  Two micrographs of the dozen or so from this animal (I still have the Epon 812 blocks probably) and immediately I noticed two intravascular lymphocytes (probably medium size lymphocytes) making a quick pass by two platelets. One even has about 4 little surface folds reaching out to the lymphocyte.  I am not drawing any conclusions from two cells and two micrographs, but found it interesting, and would be highly surprised if something doesn’t point to this interaction, under some normal and experimental circumstances, as being significant.


More surface area where? Lungs or GI tract

I have tried to figure out how many square meters are involved in the interface of our environment in lungs and in intestines. I think it is fair given the low surface are of skin to consider it as secondary in m2 to the other two. I think i remember around 17 m2  or something close. But I have read 2 publications that have shown up in numerous lay publications as well that say the gut has less surface area than previously determined.  The early estimates (that is, when looking at plicae, villi, AND micovilli – when they exist on epithelial cells in the gut) that the m2  was something on the order of about 7000. The similar number for lung was between 30 and 200 m2 .  I don’t know which is right, but the numbers for lung appear now to be more around 70 m2 , and the numbers for gut are also around 200 m2 .  this would make these wet surface areas equivalent….  I think that is hard to believe.  I am not suggesting one can be had without the other (LOL), but the mere number of microvilli, on the epithelial cells in the gut just is staggering, and the microvilli on type II cells in the lung, just not the same (the gut microvilli are actually brush border type structures, rigid, numberous, close together) while only a few little plasmamembrane blips on the alveolar cells exists, and random floppy microvilli on alveolar type II cells.

Just for me it would be hard to think of them being any near the same, and even then with the reduced value for gut, (down from the 7000 m2 ) still is a greater surface area than lung.

THUS, gut is the greater surface area interface with the environment:  so eat wisely, you are eating your environment.

Alveolar type II cell in rat: vinyl chloride and vitamin C

I am posting this not really as a huge project, but just as a reminder to self, and to those interested that sometimes data are lost and forgotten but can still have meaning. The study mentioned here was just part of a very large study which was conducted by a good friend (late, actually many years passed on) who was very careful in what she did, and didn’t press conclusions or publications beyond their real findings. She was also a good friend.  Dr. Martha Radike (who did these inhalation experiments at the University of Cincinnati, College of Medicine, Department of Environmental Health, back in the 1980s.  The test animals  (160 male Hartley guinea pigs) represented significant effort.  I did some of the electron microscopy but never completed a manuscript on the animals (and they represented only 18 out of the sum total of the experiment.

My interest in the guinea pigs was revitalized while doing a bigger review of over 1400 micrographs looking specifically for a granule of surfactant protein in alveolar type II cells.  So this study I brought up out of the archives for that purpose and found a summary, which I have posted HERE as a pdf for anyone who is interested.  vinyl_chloride_vit_C_guinea_pig_lung

Here is an enlarged image from that pdf.

vinyl_chloride_vit_C_guinea_pig_lung

Not much question that these are the same structures in type II cells

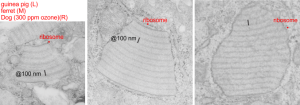
Electron micrographs of portions of alveolar type II cells: Two micrographs on the left are from my research, guinea pig on the left, ferret in the middle. The image on the right comes from a publication in 1973 by Stephens, Freeman, Stara and Coffin which had to do with exposure of beagle dogs to ozone.  The claim that ozone increased these protein bodies (which for all intent and purposes match the protein body granules that I have seen in my animals), which also increased with age, particularly.  I attribute these to some kind of immune response to environemetal exposure, and/or immune disturbance (as in the case of the guinea pigs, maybe an entire room of guinea pigs in the experiment were infected with some agent that increased the proteins in lung for innate immune response.  Regardless, the point of this image is to demonstrate electron micrographs from these three species, of alveolar type II cells, showing what stress can produce in the way of organellar responses (if one can call this granule, an organelle — which begs the issue of calling Birbeck granules in Langerhans cells… organelles–again in which case these might be SP-A granules haha).  I have marked the approximate 100 nm bar in all three images, and made a sample ribosome size in each as well for suggesting magnification.  The periodicity found in the RER of the beagle electron micrograph I think was stated to be less than 100 nm… (76 nm or something instead).. you can choose.  What I have called 100 nm is nominal.

guinea_pig_ferret_beagle


Text book pictures of untreated and ozone exposed guinea pig alveolar type II cells

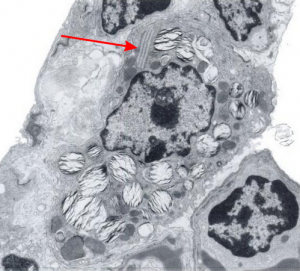
There is a book called Diagnostic Ultrastructural Pathology – A text atlas of case studies. Volume 1 ( Ann M. Dvorak, Rita A. Monahan-Earley) which on page 218 posts figure 182 (reproduced here – I thank them). It shows clearly that, while they were interested in lamellar body ultrastructure before and after ozone exposure, you can be sure that the most important structure for me is the “cisternal body” that flattened and layered protein structure that I see in the upper right-ish corner of their micrograph.  Guinea pig must have some very robust mechamism for responding to environment, producing proteins (presumably some surfactant proteins) and in this case, after ozone they do not seem to become more prominent (according to this chapter in the book) as they do in dog (see previous post), but actually become less conspicuous.

Dimensions and position within the cell are classic “cisternal body” which I really wish I could rename SP-granule.  Red arrow points to the RER granule.

diagnostic_ultrastruct_lung_book_guinea_pig

Eureka, “ah ha” !! I found reference to a study on dog lung which shows alveolar type II cell granules (cisternal bodies).

There was a group of scientists in california (I could not remember which research institute) that kindly sent me some plastic-embedded tissues of dog lung, since I had found a paper someone there that described layered protein granules in alveolar type II cells like I had seen in ferret and guinea pig and had ask them for some tissue. I could not (after 35 years, remember their names).  HERE IT IS!  awesome, though at least one of the researchers is deceased (J. Stara).  I am taking some of their electron micrographs, cropping, editing contrast (only) and placing them next to the ones I found in guinea pig and ferret.  Perfect matches.  This publication is so old (1973) that there is no way that surfactant proteins could have been implicated as possible contributing factors to these granules that appeared in their ozone treated beagle dogs.  The surfactant proteins had not yet been described.  Ozone caused what was described (for lack of background information on overall type II cell function in those days) “metabolic alteration ….. this toxic agent”, which of course is a statement which NOW in 2016 in light of decades of research on surfactant and lung function looks patronizing.

Their RER measurements made this “approximately 754 A (75 nm) is not that far off from what was calculated by my own measurements 100nm (microscopes differ in magnification tables, and so neither is likely to be exact).

Because of their reporting of small, sometimes stacked “bar like” structures such as I have seen in untreated dogs (and looking a lot like what I have seen in rabbit type II cells).  it is likely that an “excessive” amount of surfactant protein is produced and maybe stored in a multi-meric configuration) within the RER awaiting utilization in assembly within lamellar bodies or multivesicular structures. Stevens et al, 1973, mention (yippie) that there is a dense line which runs parallel to the length of the RER in these infrequently seen structures.

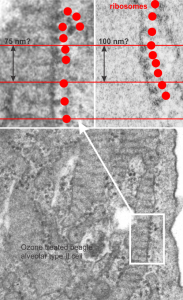
Ribosomes in the beagle exposed to ozone that border the RER profiles on the growing ends of the layered protein do look to be in similar positions with regard to banding of the granule to those found in ferret. My inclination is to think that there is a ribosomes on either side of the central band in each period (beagle on the left, ferret on the right – where central band is not really visible in this view) and a ribosome at the point of the darkest band (counted on two sides if there is only one period but counted only one one side if there are multiple periods) making each periodicity have three ribosomes, not counting the dark band of the adjacent period. One on a dark outside band, two on either side of the inner lighter central band. In the figure below, see comparative diagrams. the red lines with black arrows and text indicate what they think is 75 nm and I think is 100 nm (right) (give or take). Ribosomes are red, distance arrows are black, inset is enlarged from white box on bottom electron micrograph, dog on left (from Stephens et al, 1973, top image of figure 3, used without permission), ferret on right, my studies. Ribosomes are the bar marker (25-30 nm each). It is important to note that not all RER cisternae in their exposed animals showed periodicity…. just like those in guinea pigs… which I attribute to tangential sectioning and multiple intersections of different “growing ends”, and also the sudden transition from flattened cisternae of RER to the layered granule.

beagle_ribosomes_compare

DBC and Fe2O3 exposure: rabbit lung electron micrograph

In a study by the late Dr. David Warshawsky, I took this electron micrograph of rabbit lung after exposure to Fe2O3 (you can see the iron deposits within this cell, as they ruined the sectioning knife (not so LOL). I really don’t know what cell type this is but wanted to post the micrograph in case it was of value to anyone. I think it is probably an alveolar macrophage, but found the highly convoluted plasmalemmas found as clusters in several splaces around the periphery of this cell.  I figured it was significant, but didn’t what it represented.  Treatment would be the first big clue. 4447_17793_rabbit_DBC  and Fe2O3 .

4447_17793_rabbit_lung_DBC-Fe2O3a