Monthly Archives: May 2017

Desmosomal-mitochondrial associations

The physical proximity of mitochondria to filaments in the cytoplasm has interested me for a long time. Particularly, those associations between mitochondria and the cytokeratin filaments (tonofilaments, intermediate filaments) on the cytoplasmic side of desmosomes and the associations between mitochondria and nuclear pore filaments (those projecting from the cytoplasmic face of the pore into the cytoplasm). Anchoring plaque proteins and central proteins are pretty nice in this electron micrograph which wikipedia describes thusly: “transmembrane linker proteins, called desmoglein and desmocollin, belong to the cadherin family of cell-adhesion molecules bind to plakoglobin and other proteins in the plaques and extend into the intercellular space, where they interact, forming an interlocking network that binds two cells together”.

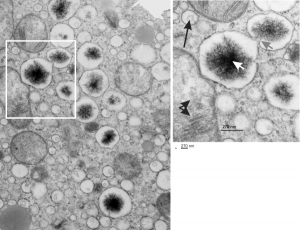
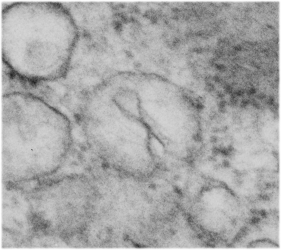
I have hundreds of examples of these interactions, the former being more numerous in some cell types, the other more numerous in others. Here is an electron micrograph of one particularly nice association between a mitochondrion and a desmosome.  There can be mitochondria on both sides of a desmosome as sectioned in 2D, which begs the question of the 3D aspects of these associations.

electron micrograph of mitochondrion associated with desmosome

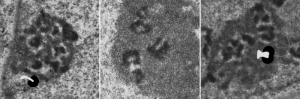
In fact, a single mitochondrion can be associated with more than one desmosome, and can also touch on the cytoplasmic-side-filaments of more than one nuclear pore.  M, mitochondrion, arrow, desmosome, bar= 100nm dot is 27 nm by ribosome. Mouse liver female control C4.


Nuclear pores: diagrams vs micrographs

It is sometimes difficult to reconcile all the graphics that appear in research articles with what actually one sees with the electron microscope.  There are artists and scientists trying to communicate facts and abstract ideas and the results are something hysterical.

Anyway, in looking at the 14CoS ko 48 hr no rescue nucleus in an hepatocyte I found this nuclear pore which actually had what looks like some of the 8-mer basket proteins that were quite clear.  I have highlighted those (on the nuclear side of the pore) in blue and highlighted the cytoplasmic side with cytoplasmic filaments in rust color.  One can see from a diagram from wikipedia (thank you wikipedia) which I have extensively simplified and modified, that the original and what I have seen in actuality don’t really fit.  I cut the diagram apart and extended the inner nuclear membrane space, shrunk up the basket and extended the cytoplasmic filaments (see diagram on the right).  The other issue is likely that the micrograph tends to show the pore from the ” cytoplasmic viewpoint” or bottoms up, while the diagram looks more “at the horizontal level”.  Basically, the nuclear pore complex is an absolute wizard structure… fun to learn about. This electron micrograph is from a 48 hr old 14CoS ko pup, not rescued with NTBC. 18750_80206_anim#35 liver.  More posts on this topic HERE.

48 hr old 14CoS ko pup, not rescued with NTBC. 18750_80206_anim#35 liverWhat i have trouble visualizing with electron microscopy are the three rings…. the cytoplasmic ring, the nuclear side ring and that ring structure that individuals claim is at the rounded fusion of the trilaminar inner and outer nuclear membranes.

Here is another nuclear pore from the same electron micrograph in which I have highlighted the four areas which perhaps will correspond to the nuclear side ring 2 dots at the bottom (along with light blue arrow of some particle just on the way out of the nucleus likely) and the cytoplasmic side ring above). Orange arrow points to where the trans membrane ring should be seen.

nuclear pore complex electron microscopy

RECALCULATING

recalculating recalculate lifeThere is an advertisement on TV, public TV or a common network channel  in cincinnati, which i think is totally brilliant. Brilliant in all ways, philosophically, medically, evolutionarily, spiritually, morally, ethically and even cosmically.  So this is an add for JEEP, and I am not recommending that anyone buy this car but am surely thinking this is a great comment on how to live life, maybe one of the best “sermons” i have heard.

It begins with a simple theme, a situation of confusion or dilemma, or abstract choice, and then a  situation depicting an about face, a change, recovery, or repair.   Aside from the background noise and the video images appropriate to the situation, the only verbal audio is  the computer-voice saying  “recalculating”.  This concept of event, reparation, and audio is iterated probably 8 times, each time with the word “recalculating”.  In biology we call this “adapt” or “die”.  The evolution of life has programmed into each organism a complex and so-far-poorly understood set of “recalculating” mechanisms that act to maintain the viability of the species, such as , iRNA, epigenetics, DNA error detection and repair, antioxidants, immune functions, cell proliferation, cognition, detoxication organs, hundreds and hundreds of enzymes all variable and ready and waiting to “recalculate”.

Not to requote an already well known quote —  “we are fearfully and wonderfully made” ready and equipped for recalculating every circumstance.

Never never lose your feelings of amazement of how adaptable we can be.

Philosophies

Maybe buddhism is about “get along with the journey rather than fighting it” certainly islam is sort of about “fight it or you go to hell”, pretty clearly judaism is legalistic, “mind it, regardless”, taoism suggests that you should “go with the flow” in the essence of unknowability,  shintoism, “everything has spirit and power”, hinduism,  “the eternal way everything is sacred”, and my preference is christianity as it speaks to my humanity and is all about grace… “you screwed up, so forget it, you can do better so try again”.cross crescent mandala buddhism religions icons star of david images
None of these really tries to examine or explain the cosmos with technical facts, truth, biophysics, but knowing the origin of the universe is really what interests me, as a “knowable” thing… it is so like me to pick out an infinite and unsolvable problem and bang my head on it for eternity…

Liver: Vesicles within vesicles – electron micrographs

I have not really found the equivalent of the electron dense particles in the RER of Gclc mice (posted yesterday) for conditional liver ko animals rescued with NAC at 60d. I have also not found an equivalent (googling and other pathology type searches) for the iron spicules found within those partially RER vesicles.   However I did come close to finding a match for the vesicles within vesicles (though these cells were in vitro, not liver, and not in vivo). The partial publication URL which shows iron particles (USPIO nanoparticles at iron concentrations of 50 μg/ml)(link here) which are NOT LIKE the spicules found in the mice I am looking at, but does show something like the vesicular changes, that is, the vesicle-within a vesicle configuration.

I have pseudocolored the vesicles to compare orange, and on the left is the image from the Gclc conditional ko rescued with NAC, and on the right is the cell line (Canine ADSCs or canine adipose derived stem cells) treated by these researchers with iron.  Red arrows point to the vesicles within vesicles, black arrow from their micrograph point to nanoparticles of iron.  Heavy metal (maybe iron in left hand micrograph) looks like a fuzzy black iron filing mass pulled by a magnet into a glump, very different from the iron in the micrograph on the right. It is critical to point out that the vesicles are pretty much ribosome free, while those RER bound objects with electron dense (presumptive iron) have ribosomes, at least over part of their surface.

electron microscopy liver possible iron deposits vesiclesHere is another example of metal (in this case aluminum) in tissue culture forming dense lysosomal bodies.

Electron micrograph of liver: Alb w/c Gclc i/i D60 NAC rescue – color

A portion of the previous post has been enlarged and also pseudocolored in photoshop. The ribosomes from this portion of an hepatocyte are colored purple, this is mainly to emphasize that whatever these vesicles are in the cytoplasm of the rescued mice do have some kind of protein being produced.  The portions of the vesicle membrane that are occupied by ribosomes is not that great, when found, too, they assume a position as if a string of 4-8.  The vesicles in tandem, themselves are colored bright yellow.  The contents of the vesicles needs no coloring it is very electron dense and likely to contain iron, be iron, or some other combinations of metals.

17902_74138_706_wcii_nac_60d_(colored).  Please note that on the right hand side, unretouched vesicles and inclusions are found, just in case you need to check. On the left hand side of the lowest vesicular blip, find three very nice ribosomes, but the remainder of the vesicle has but one or two additional ribosomes about the periphery.


Electron micrograph of liver: Alb w/c Gclc i/i D60 NAC rescue

The four (maybe there are more) things that I noticed about the GCLC conditional KO mouse hepatocytes were 1: vesicles within vesicles, 2: lucent areas of mitochondiral matrix adjacent to quite well organized stacked cristi, 3: iron-like staining spicular deposits in dilated RER of hepatocytes, and 4: there is a linked-look between the ballooned areas of the ER (both smooth and rough).

These mice have survived the KO of GCLC, for 60 days, because they were rescued with N-acetyl-cysteine (NAC). NAC reportedly helps replenish the intracellular glutathione supply and can lessen hepatocyte oxidative damage occuring with the knock out of glutamate cysteine ligase catalytic subunit (Gclc), explained HERE. NAC affords protection against the oxidative stress, DNA damage and cancer development and cell death, thus rescues a genetically determined depletion of hepatocyte glutathione. I examined a large series of mouse tissues from these animals and their appropriate controls and while some of these data were published, there was much that never made it into the literature. Thus…. these posts, hoping that someone can be helped by these electron micrographic images of the unrescued, the controls and the NAC-saved mice.

So the micrographs below have RER (albeit the ribosomes are really not that nicely arranged in spirals or grids) and the transition from RER to ER is not consistent with typical RER to SER transitions (that is; both small and large vesicles, empty and full of electron dense filaments; those with center vesicles and those without (almost like continuous segmented mini-intussuceptions, are kind of a large mix of different types, sizes, filled and empty vesicles. These vesicles begin to develope before D60 after NAC rescue, and increase with increasing time.

negative block and animal and treatment: 17902_74138_706_wcii_nac_60d. Size of a ribosome (at 27 nm) was used to calculate the bar markers (smallest black dot below. Inset from image on left is bounded with a white box, enlarge just around 2x on the right). Black arrow points to vesicle-within-a-vesicle phenomenon which is totally everywhere; double headed black arrow points to two types of mitochondrial inner membrane organization, one part points to areas which are quite electron-lucent, and one points to cristi that are highly layered and flattened. White arrow points to filamentous electron dense (i would like to say “iron filings” – like) inclusions and the grey arrow points to a telescoping point between two rounded contiguous vesicles with filamentous inclusions.  Occasional ribosomes are seen on the bounding membranes of these vesicles, and as in this case, they look like peristaltic connections, dipping one end into the next rounded vesicle as if there were strictures, or boluses passing through a long undulating series of tubes. Thee are a few coiled ribosomes on an mRNA through out the cytoplasm, and not pictured some microbodies (dense bodies with uricase crystals). Image to right shows the open-closed RER, SER, ER profiles show internally.

Nucleolus and SV40 infection

Looking at the sum total of nuclear architecture seen from the viewport of the electron microscope, I am trying to summarize the topology and/or segregation of protein-DNA, protein-RNA and protein-protein domains therein.  It seems that many names have been associated with very many small structural entities within the nucleus, (and nucleolus), and not all these molecular studies have been diligent about identifying them with transmission electron microscope (actually using fluorescent probes and light microscopy gives pretty pictures, merging reds and greens — but this is still like looking at the barn door when one wants to see the insects on the wood) thus making it a little difficult to interpret their results. I did find an early manuscript, from 1963, which helps, published just about 10 years after the commercial availability of the electron microscope (yes I laughed since the author of the manuscript named the equipment, an old Seimens 1 — the microscope I used for 30 years was the next generation, the Seimens 1A.  yep, old).

nucleolus electron microscopy SV40
The publication is by Nicole Granboulan and appears to be readily available for perusal and it focuses on the nucleolus, a portion of the nucleus dedicated to ribonucleoprotein biogenesis. I have taken portions of three micrographs, an uninfected, and two SV40 infected, and put them side by side to show the changes in the nucleolus as it becomes a production site for viral pre-ribosomes as shown by the great increase in the granular area as time after SV40 infection increased. There is an augmentation to the dense fibrillar compartment, which initially to me looks like a crescent moon with the fibrillar centers poking in like mushroom stalks, to feed the production of viral RNA.  It is clear that the surface areas between the fibrilar centers (where the rDNA genes are located) and the inside of the crescent moon portion of the dense fibrillar areas has occurred as well. An increase in the granular component in uninfected nuclei (uninfected cells) is also occurring when cells are in S phase of the cell cycle.

The black and white diagram overlays with white arrows show the change from U to M shape of the dense fibrillar regions, and the white areas of the cartoon, being the fibrillar centers.